Web-Visualisations-Dashboard
Unit 12 | Assignment - Web Visualization Dashboard (Latitude)
Background
Data is more powerful when we share it with others! Let’s take what we’ve learned about HTML and CSS to create a dashboard showing off the analysis we’ve done.
Latitude - Latitude Analysis Dashboard with Attitude
For this homework we’ll be creating a visualization dashboard website using visualizations we’ve created in a past assignment. Specifically, we’ll be plotting weather data.
In building this dashboard, we’ll create individual pages for each plot and a means by which we can navigate between them. These pages will contain the visualizations and their corresponding explanations. We’ll also have a landing page, a page where we can see a comparison of all of the plots, and another page where we can view the data used to build them.
Website Requirements
For reference, see the “Screenshots” section below.
The website must consist of 7 pages total, including:
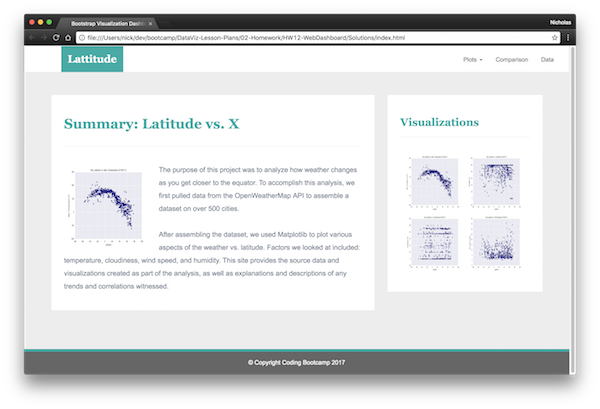
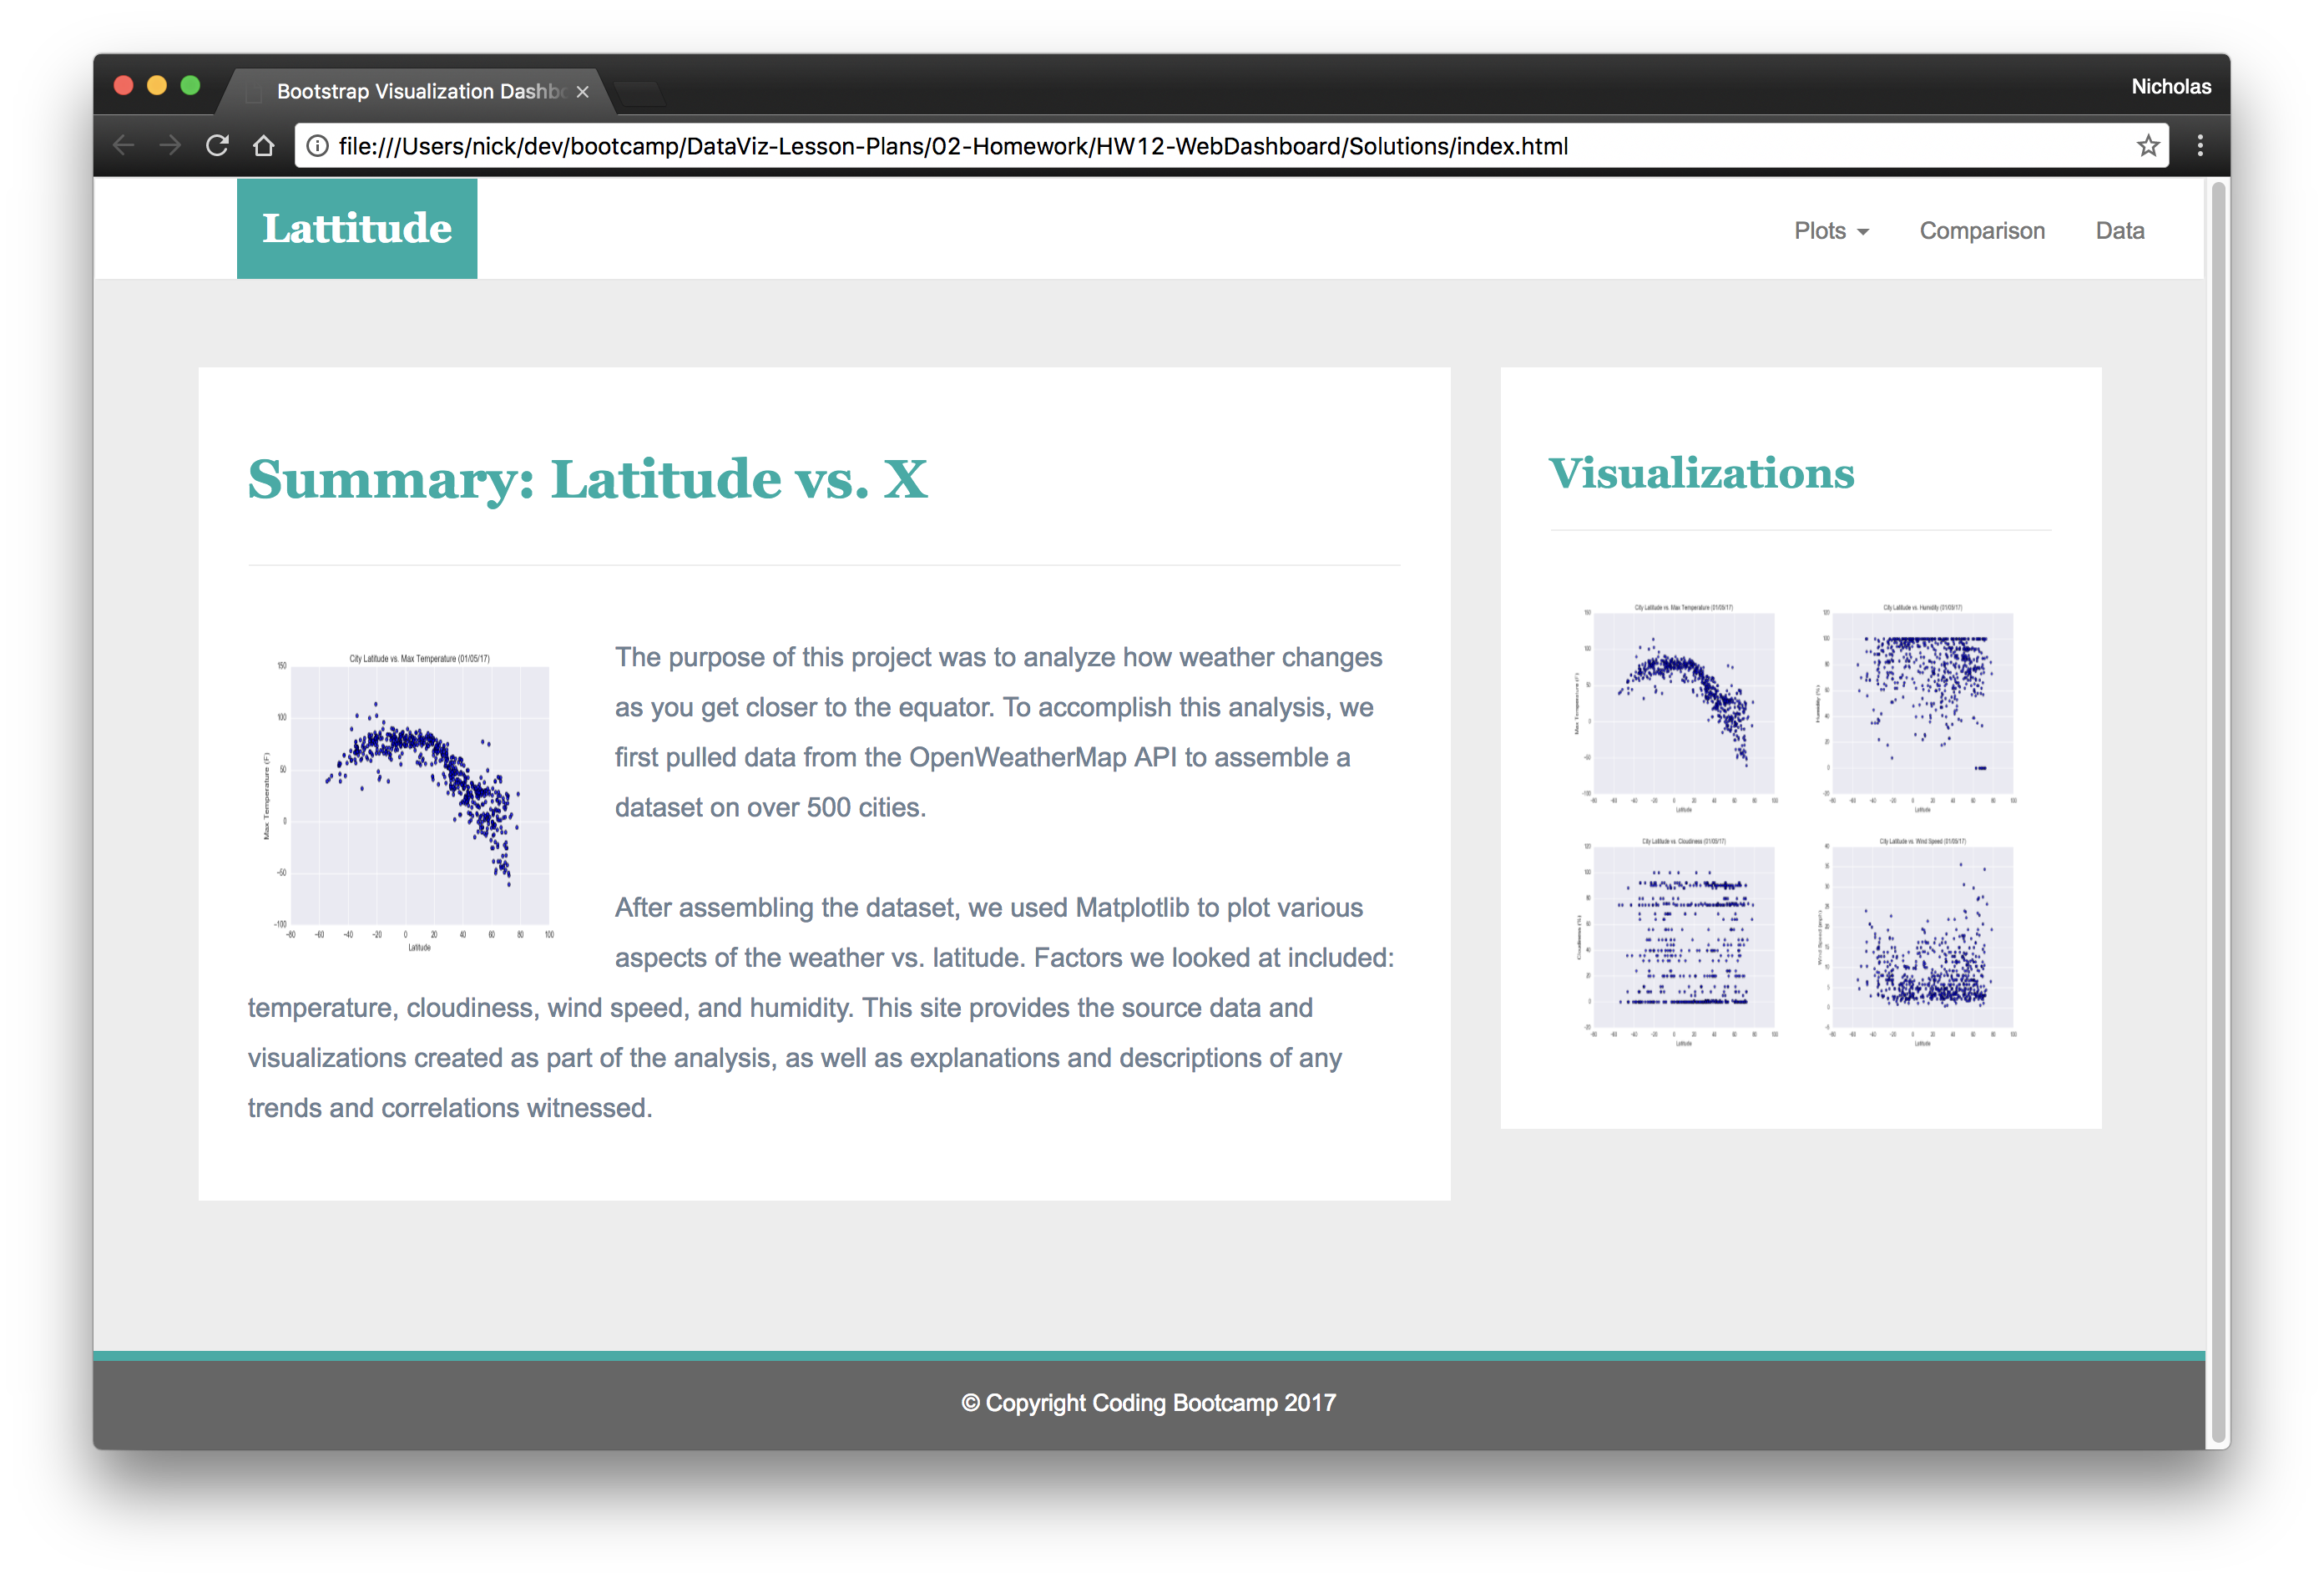
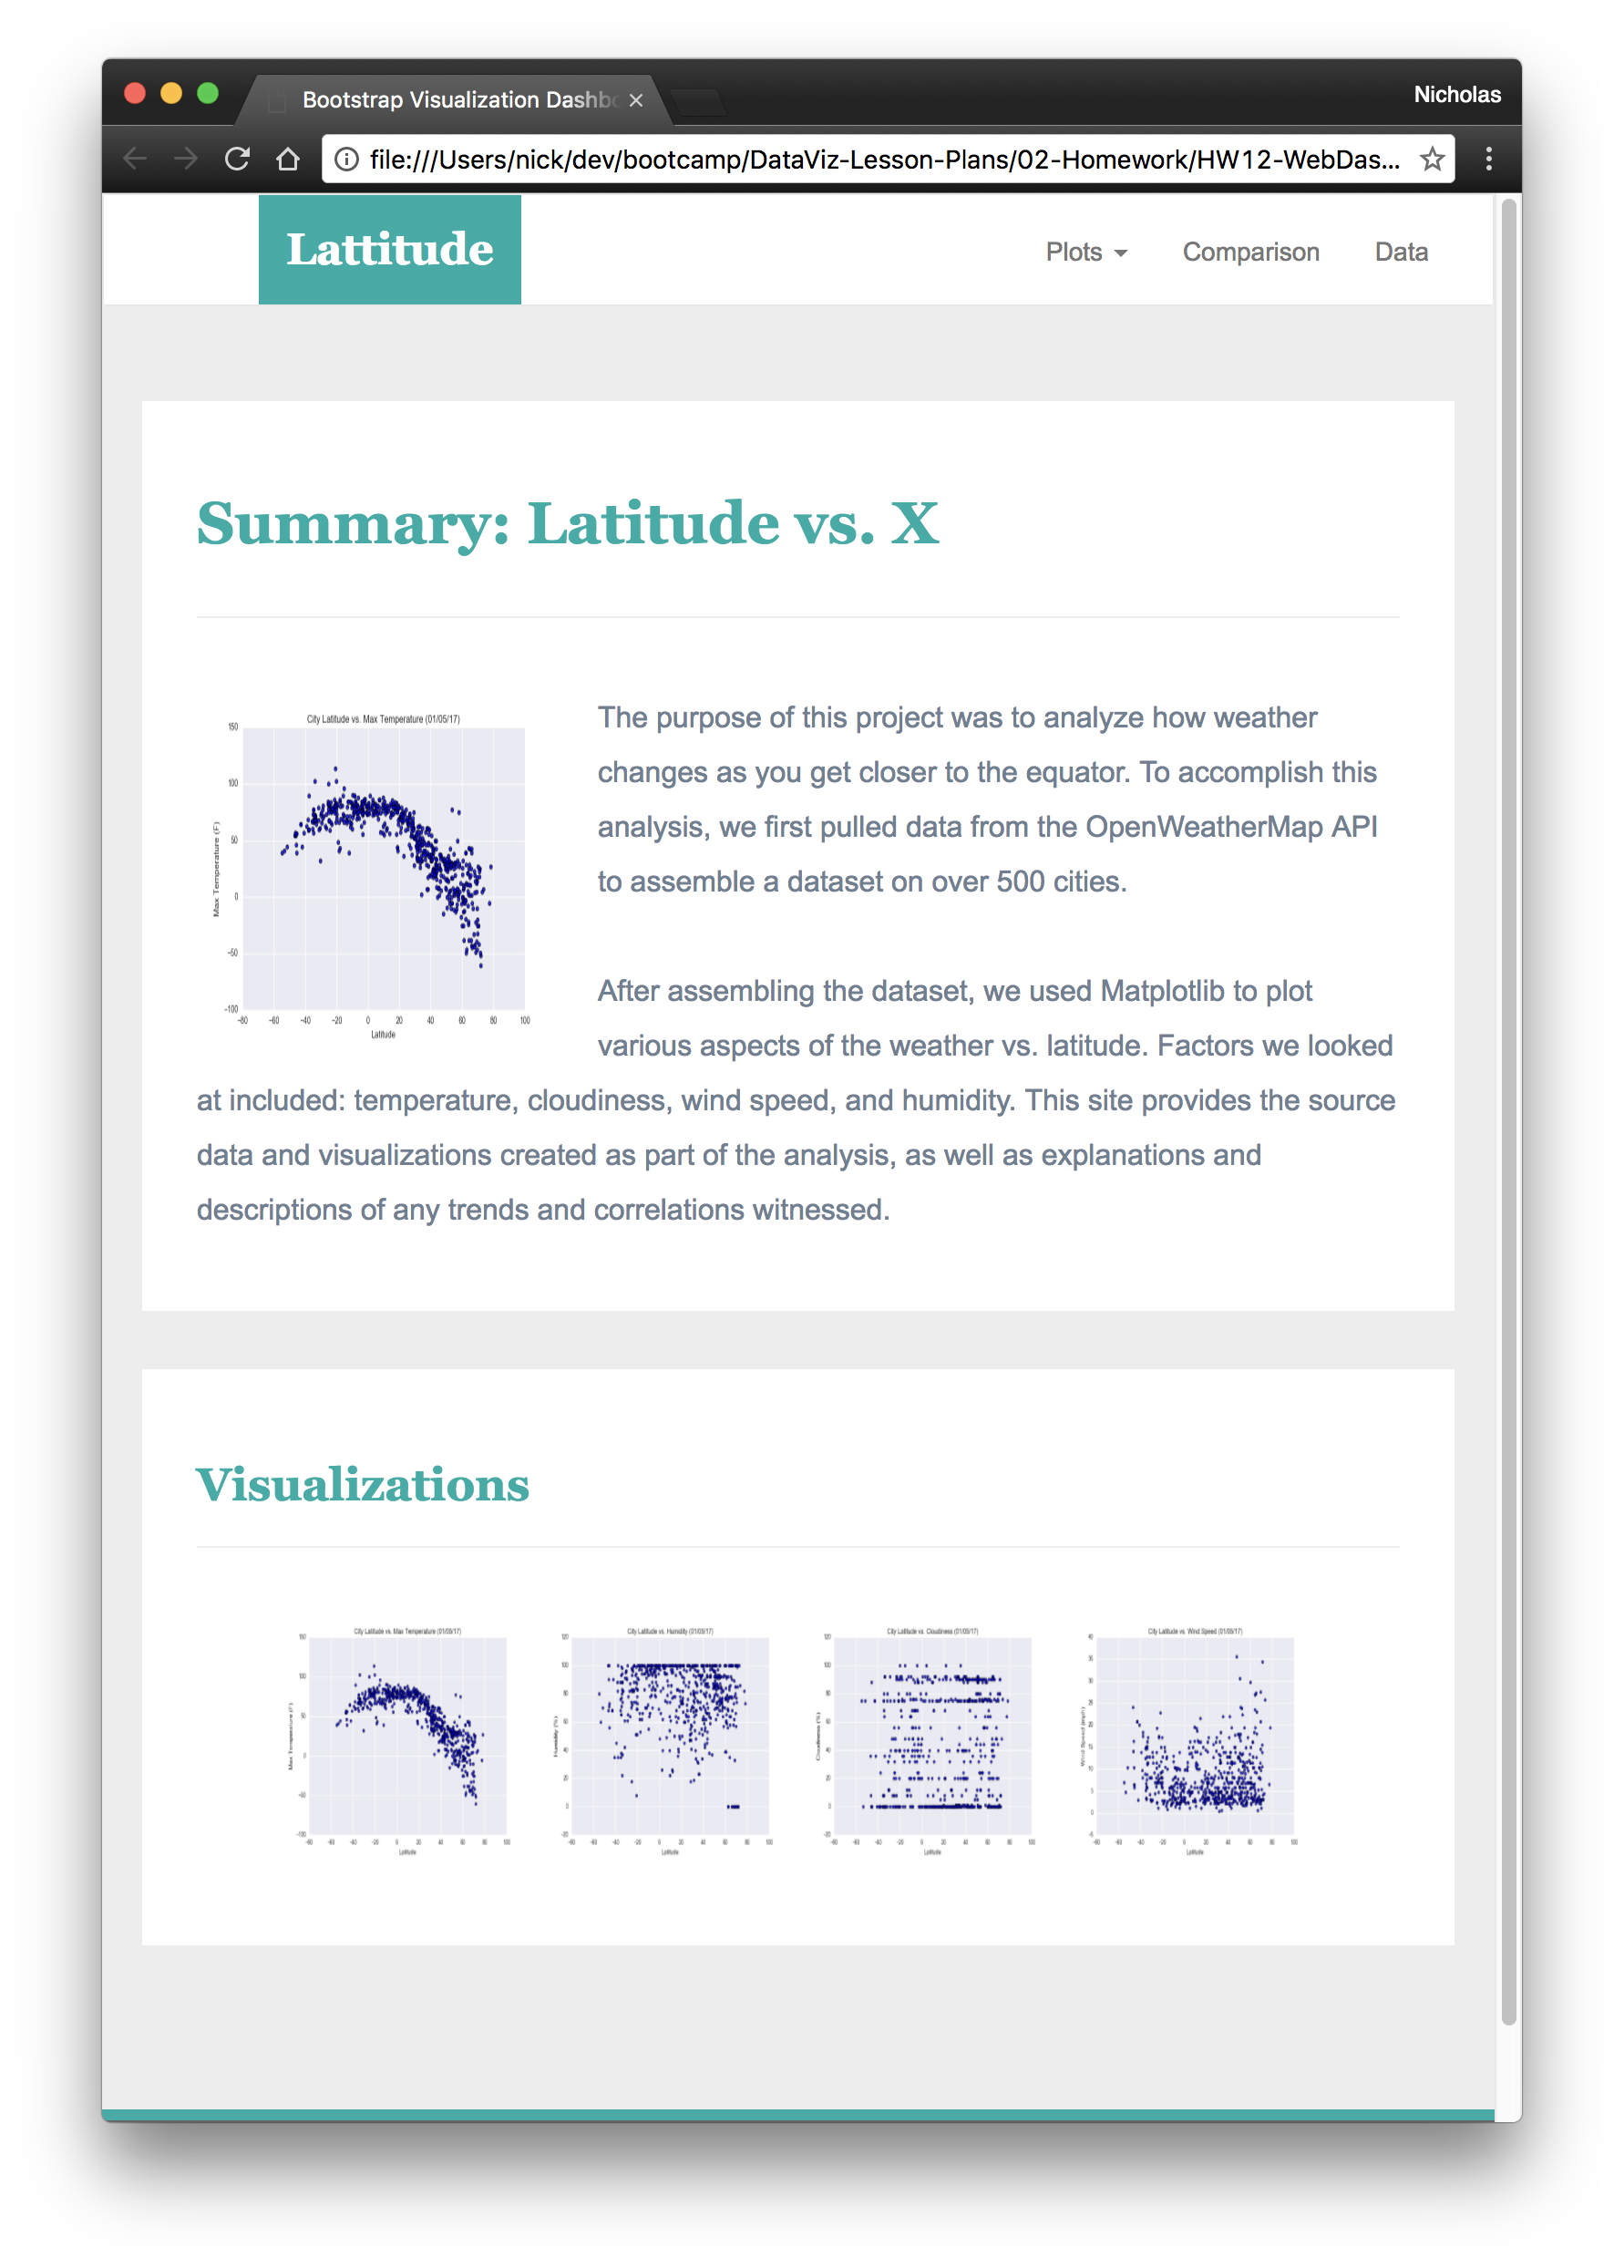
- A landing page containing:
- An explanation of the project.
- Links to each visualizations page.
- Four visualization pages, each with:
- A descriptive title and heading tag.
- The plot/visualization itself for the selected comparison.
- A paragraph describing the plot and its significance.
- A “Comparisons” page that:
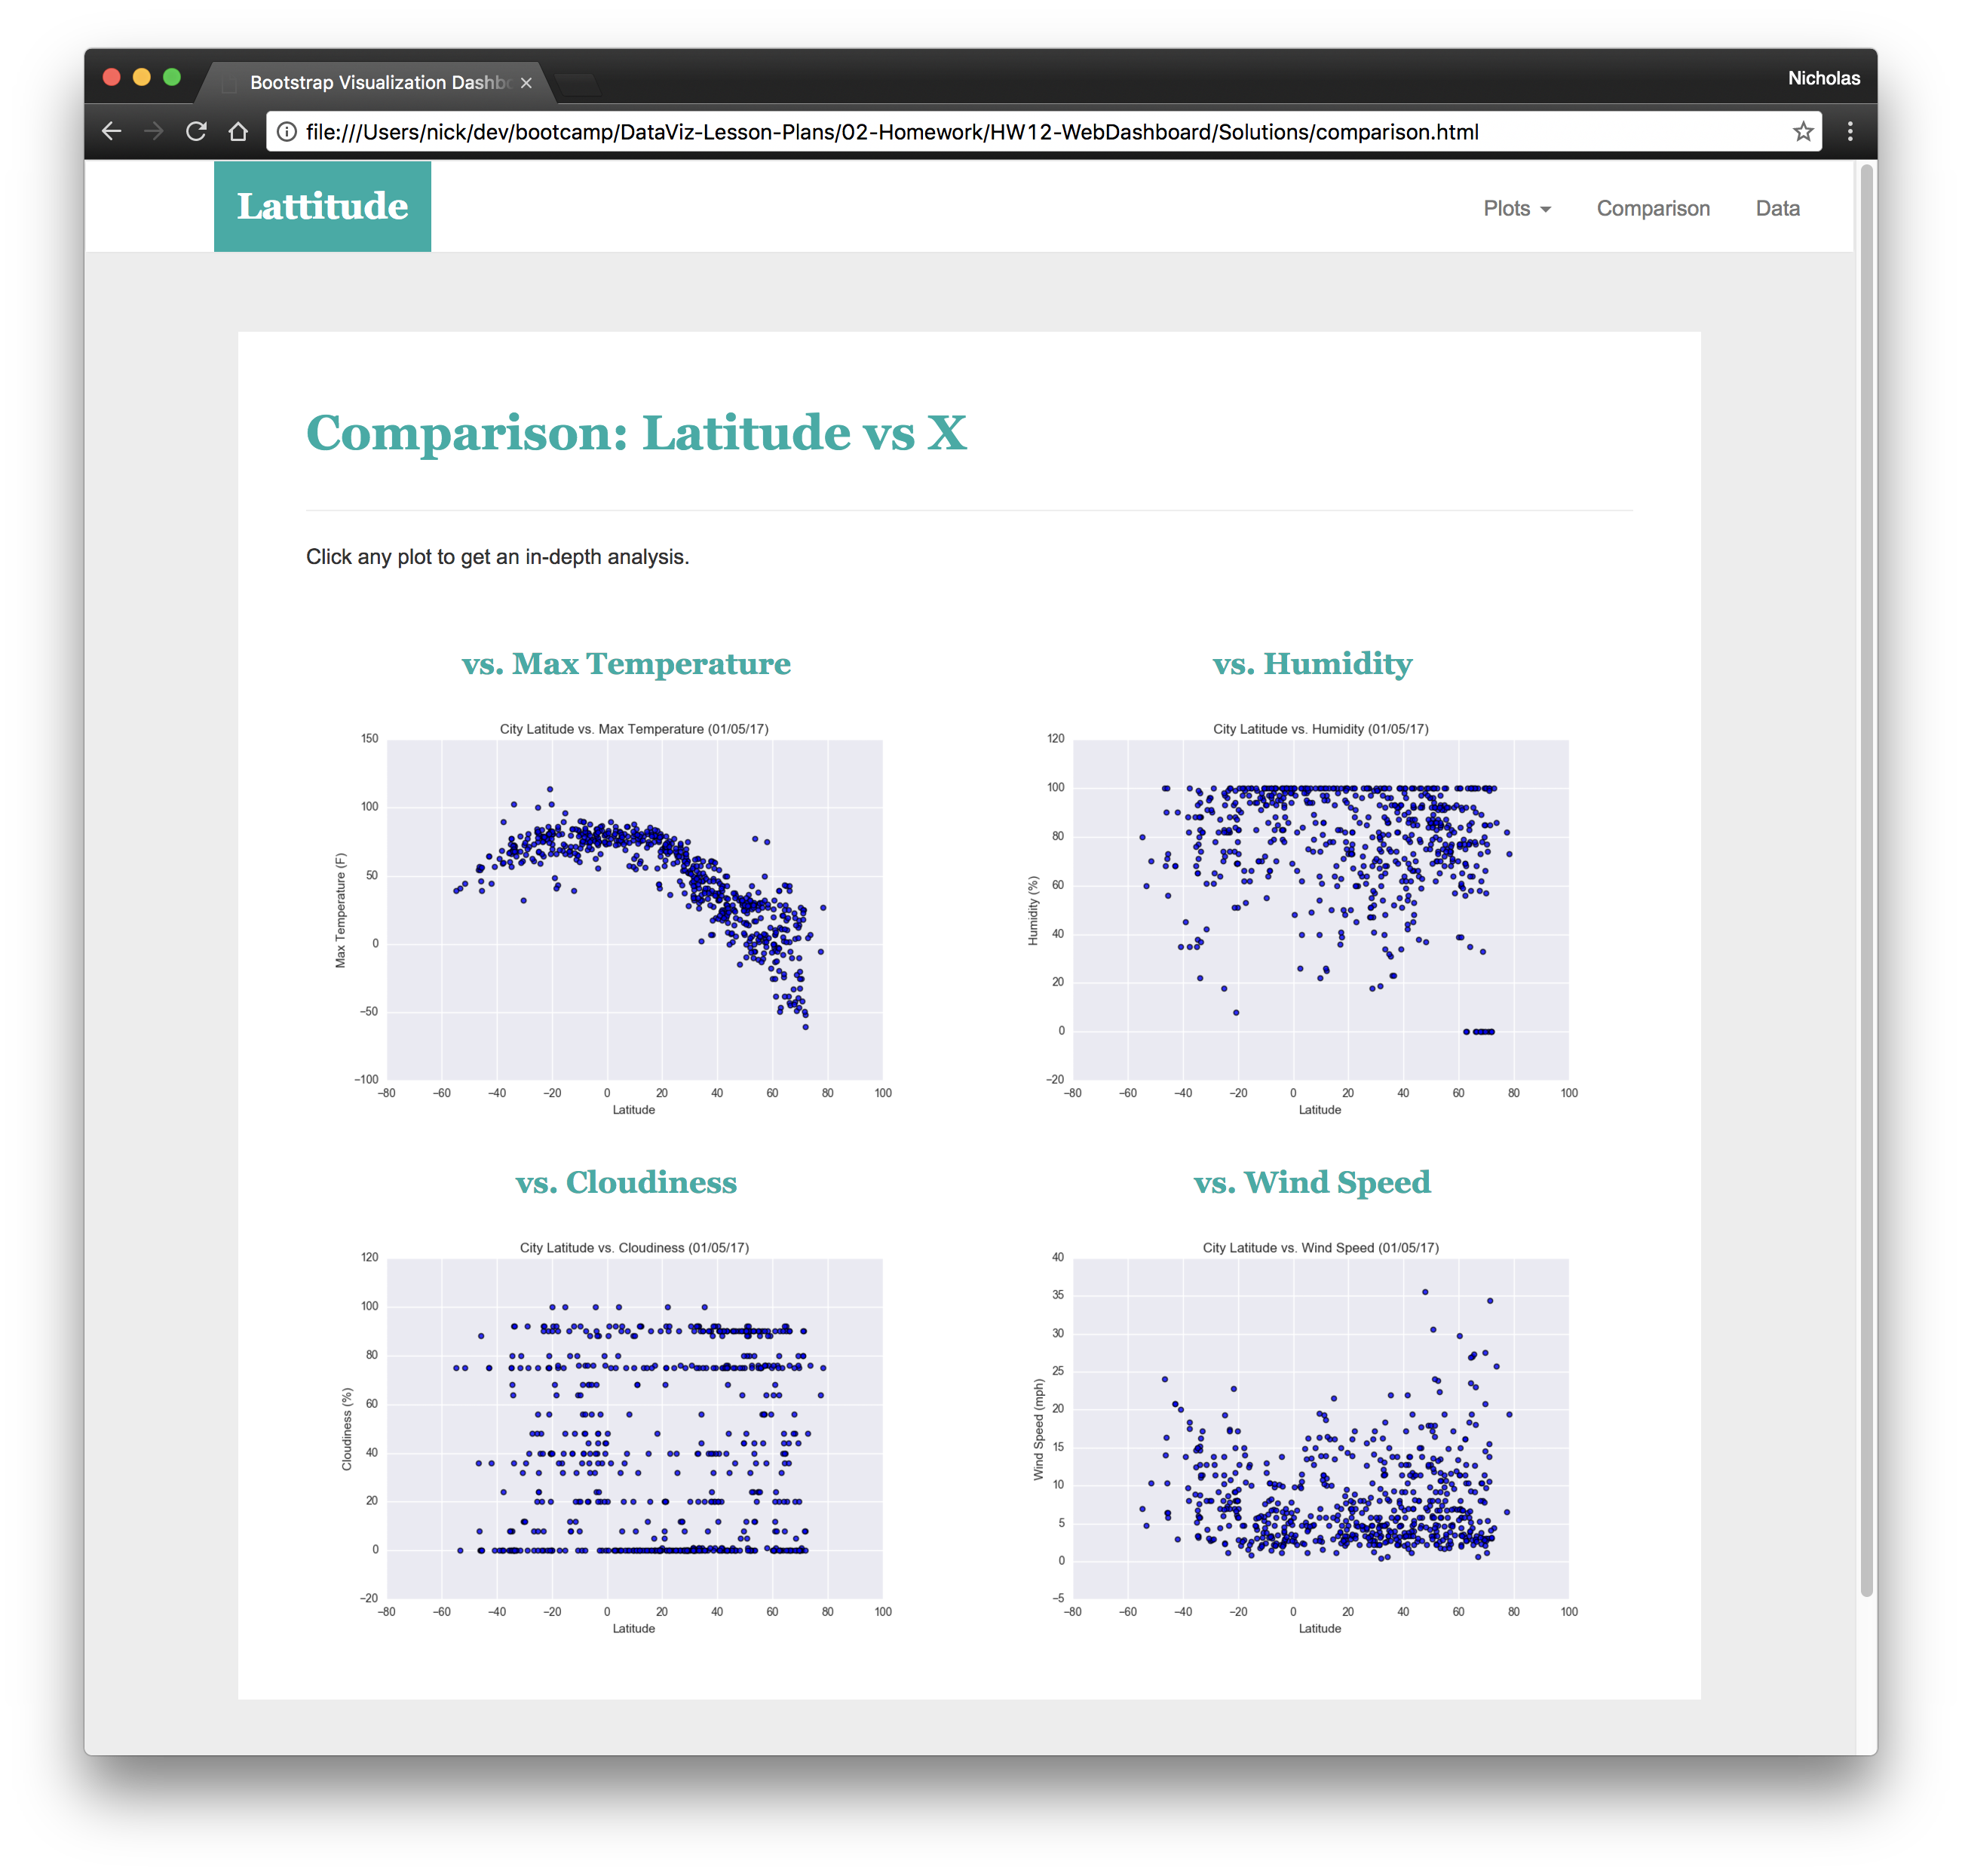
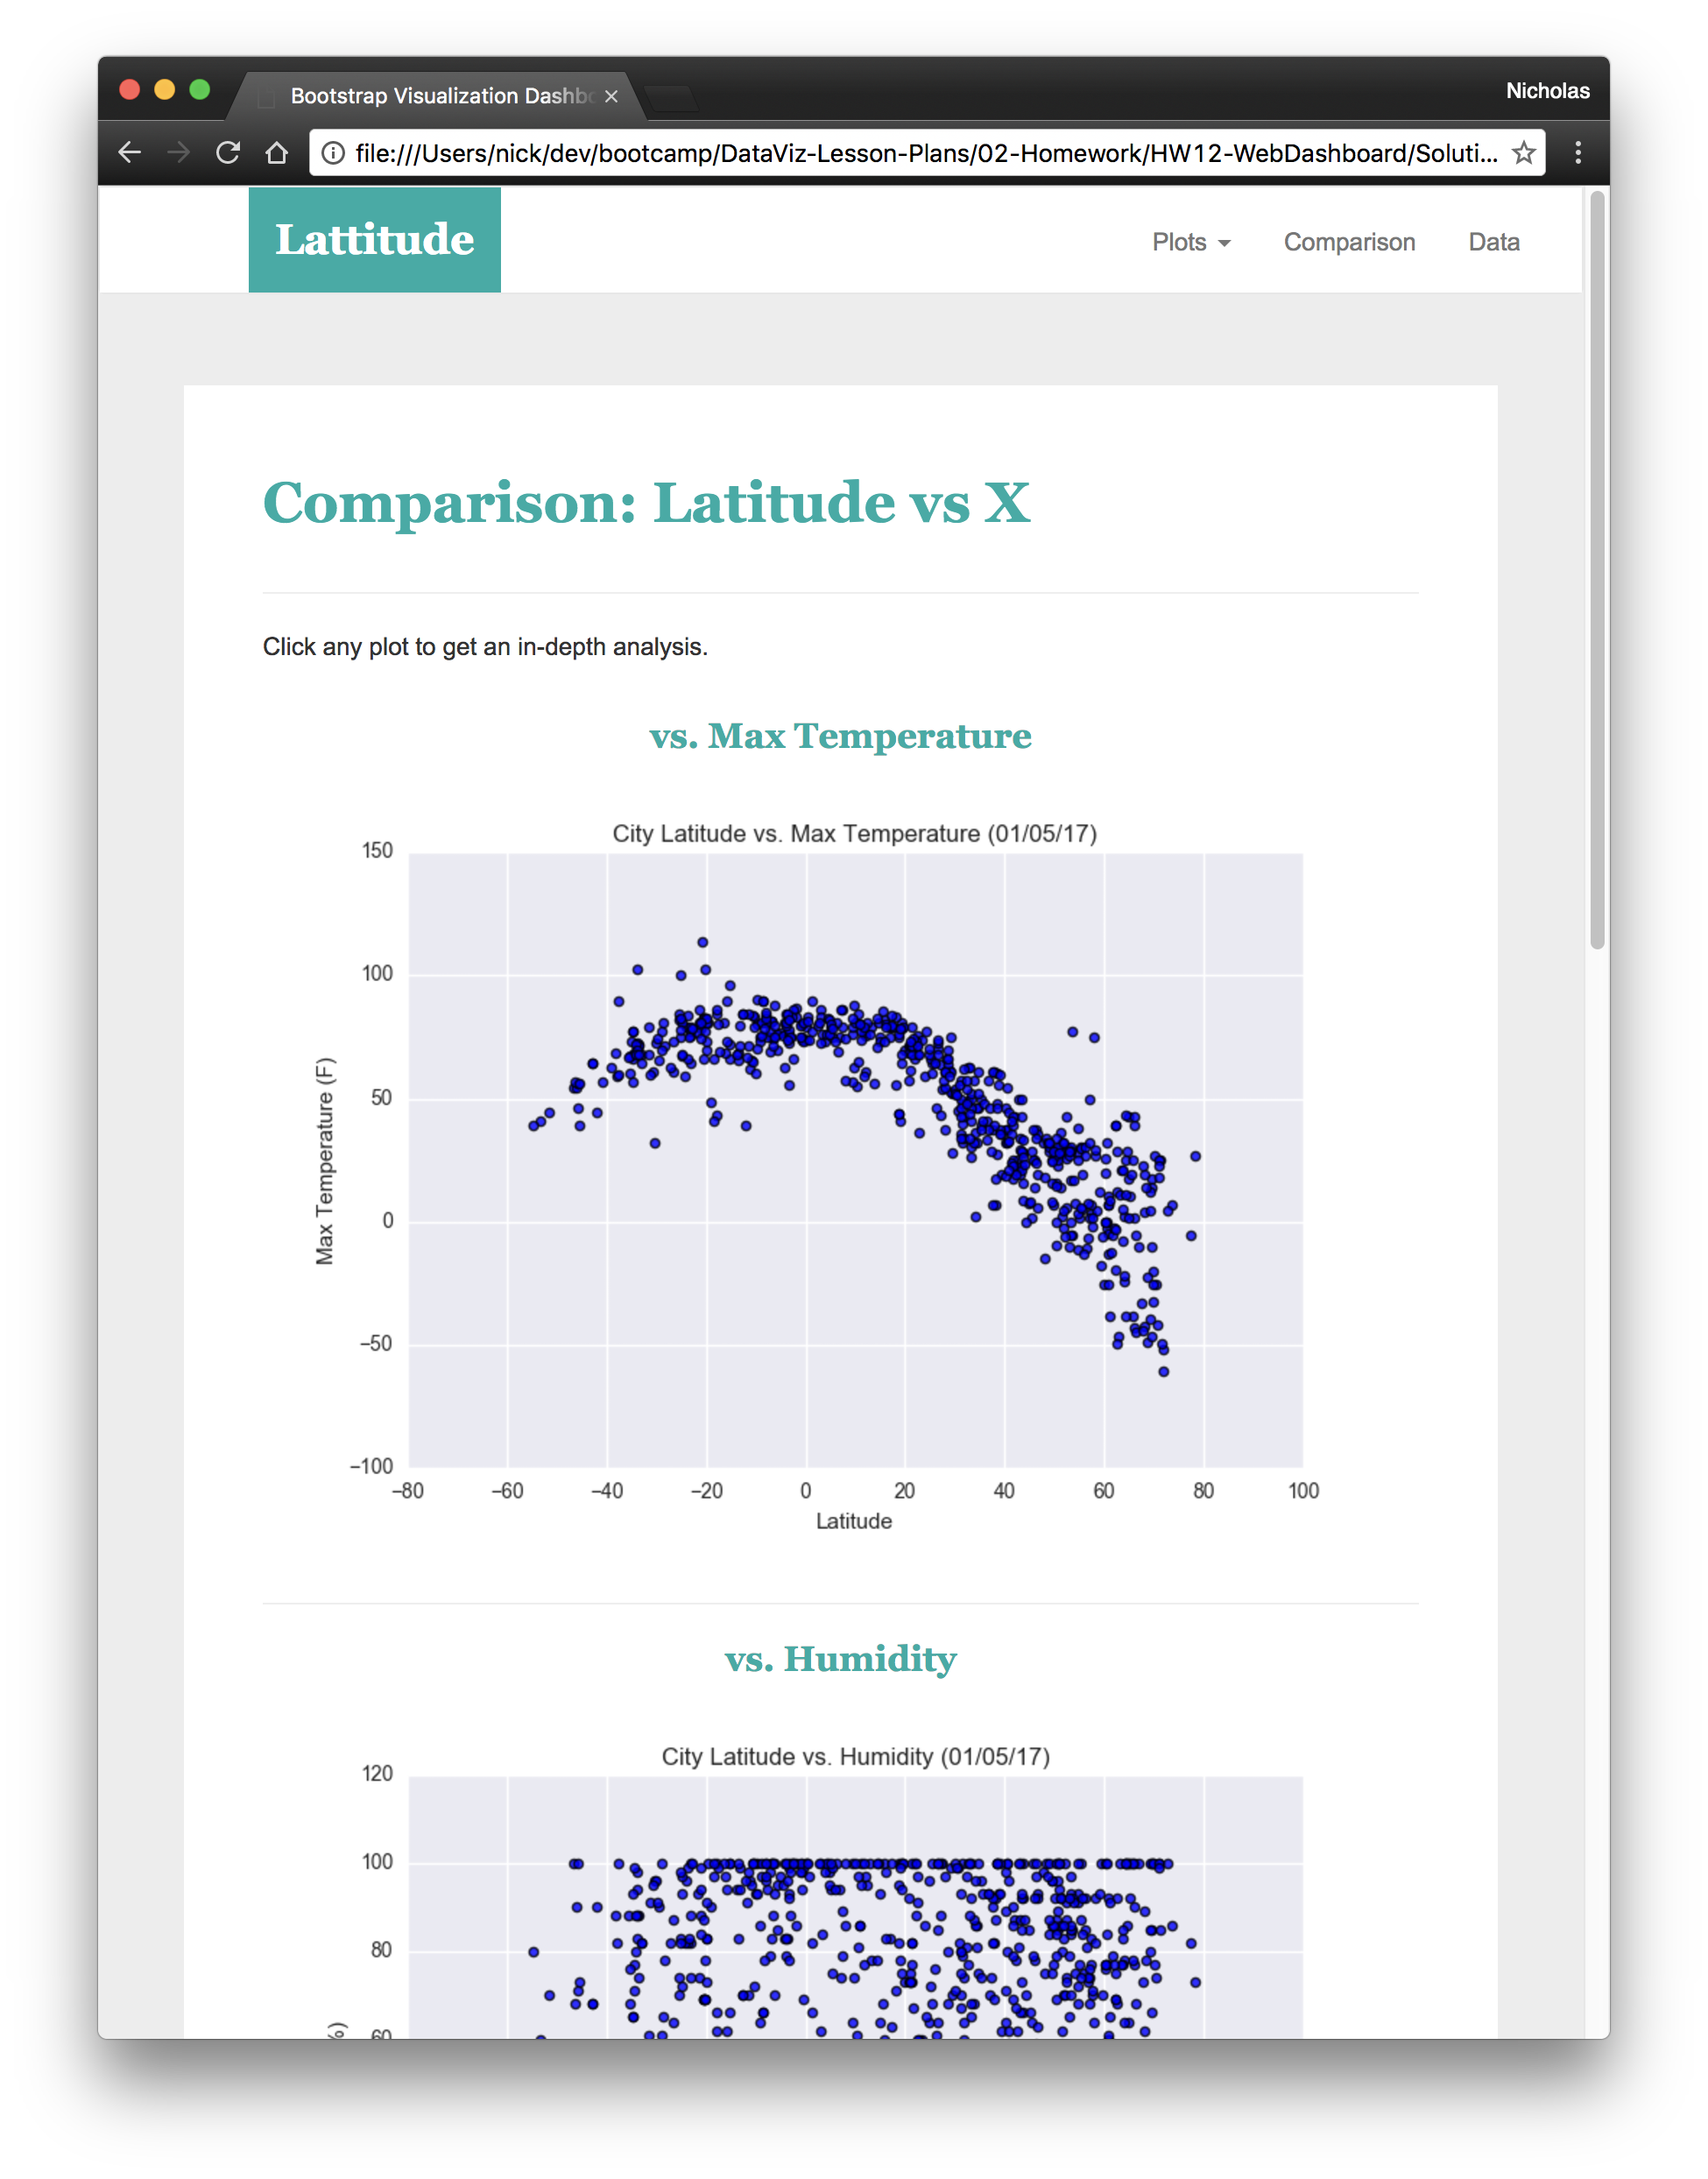
- Contains all of the visualizations on the same page so we can easily visually compare them.
- Uses a bootstrap grid for the visualizations.
- The grid must be two visualizations across on screens medium and larger, and 1 across on extra-small and small screens.
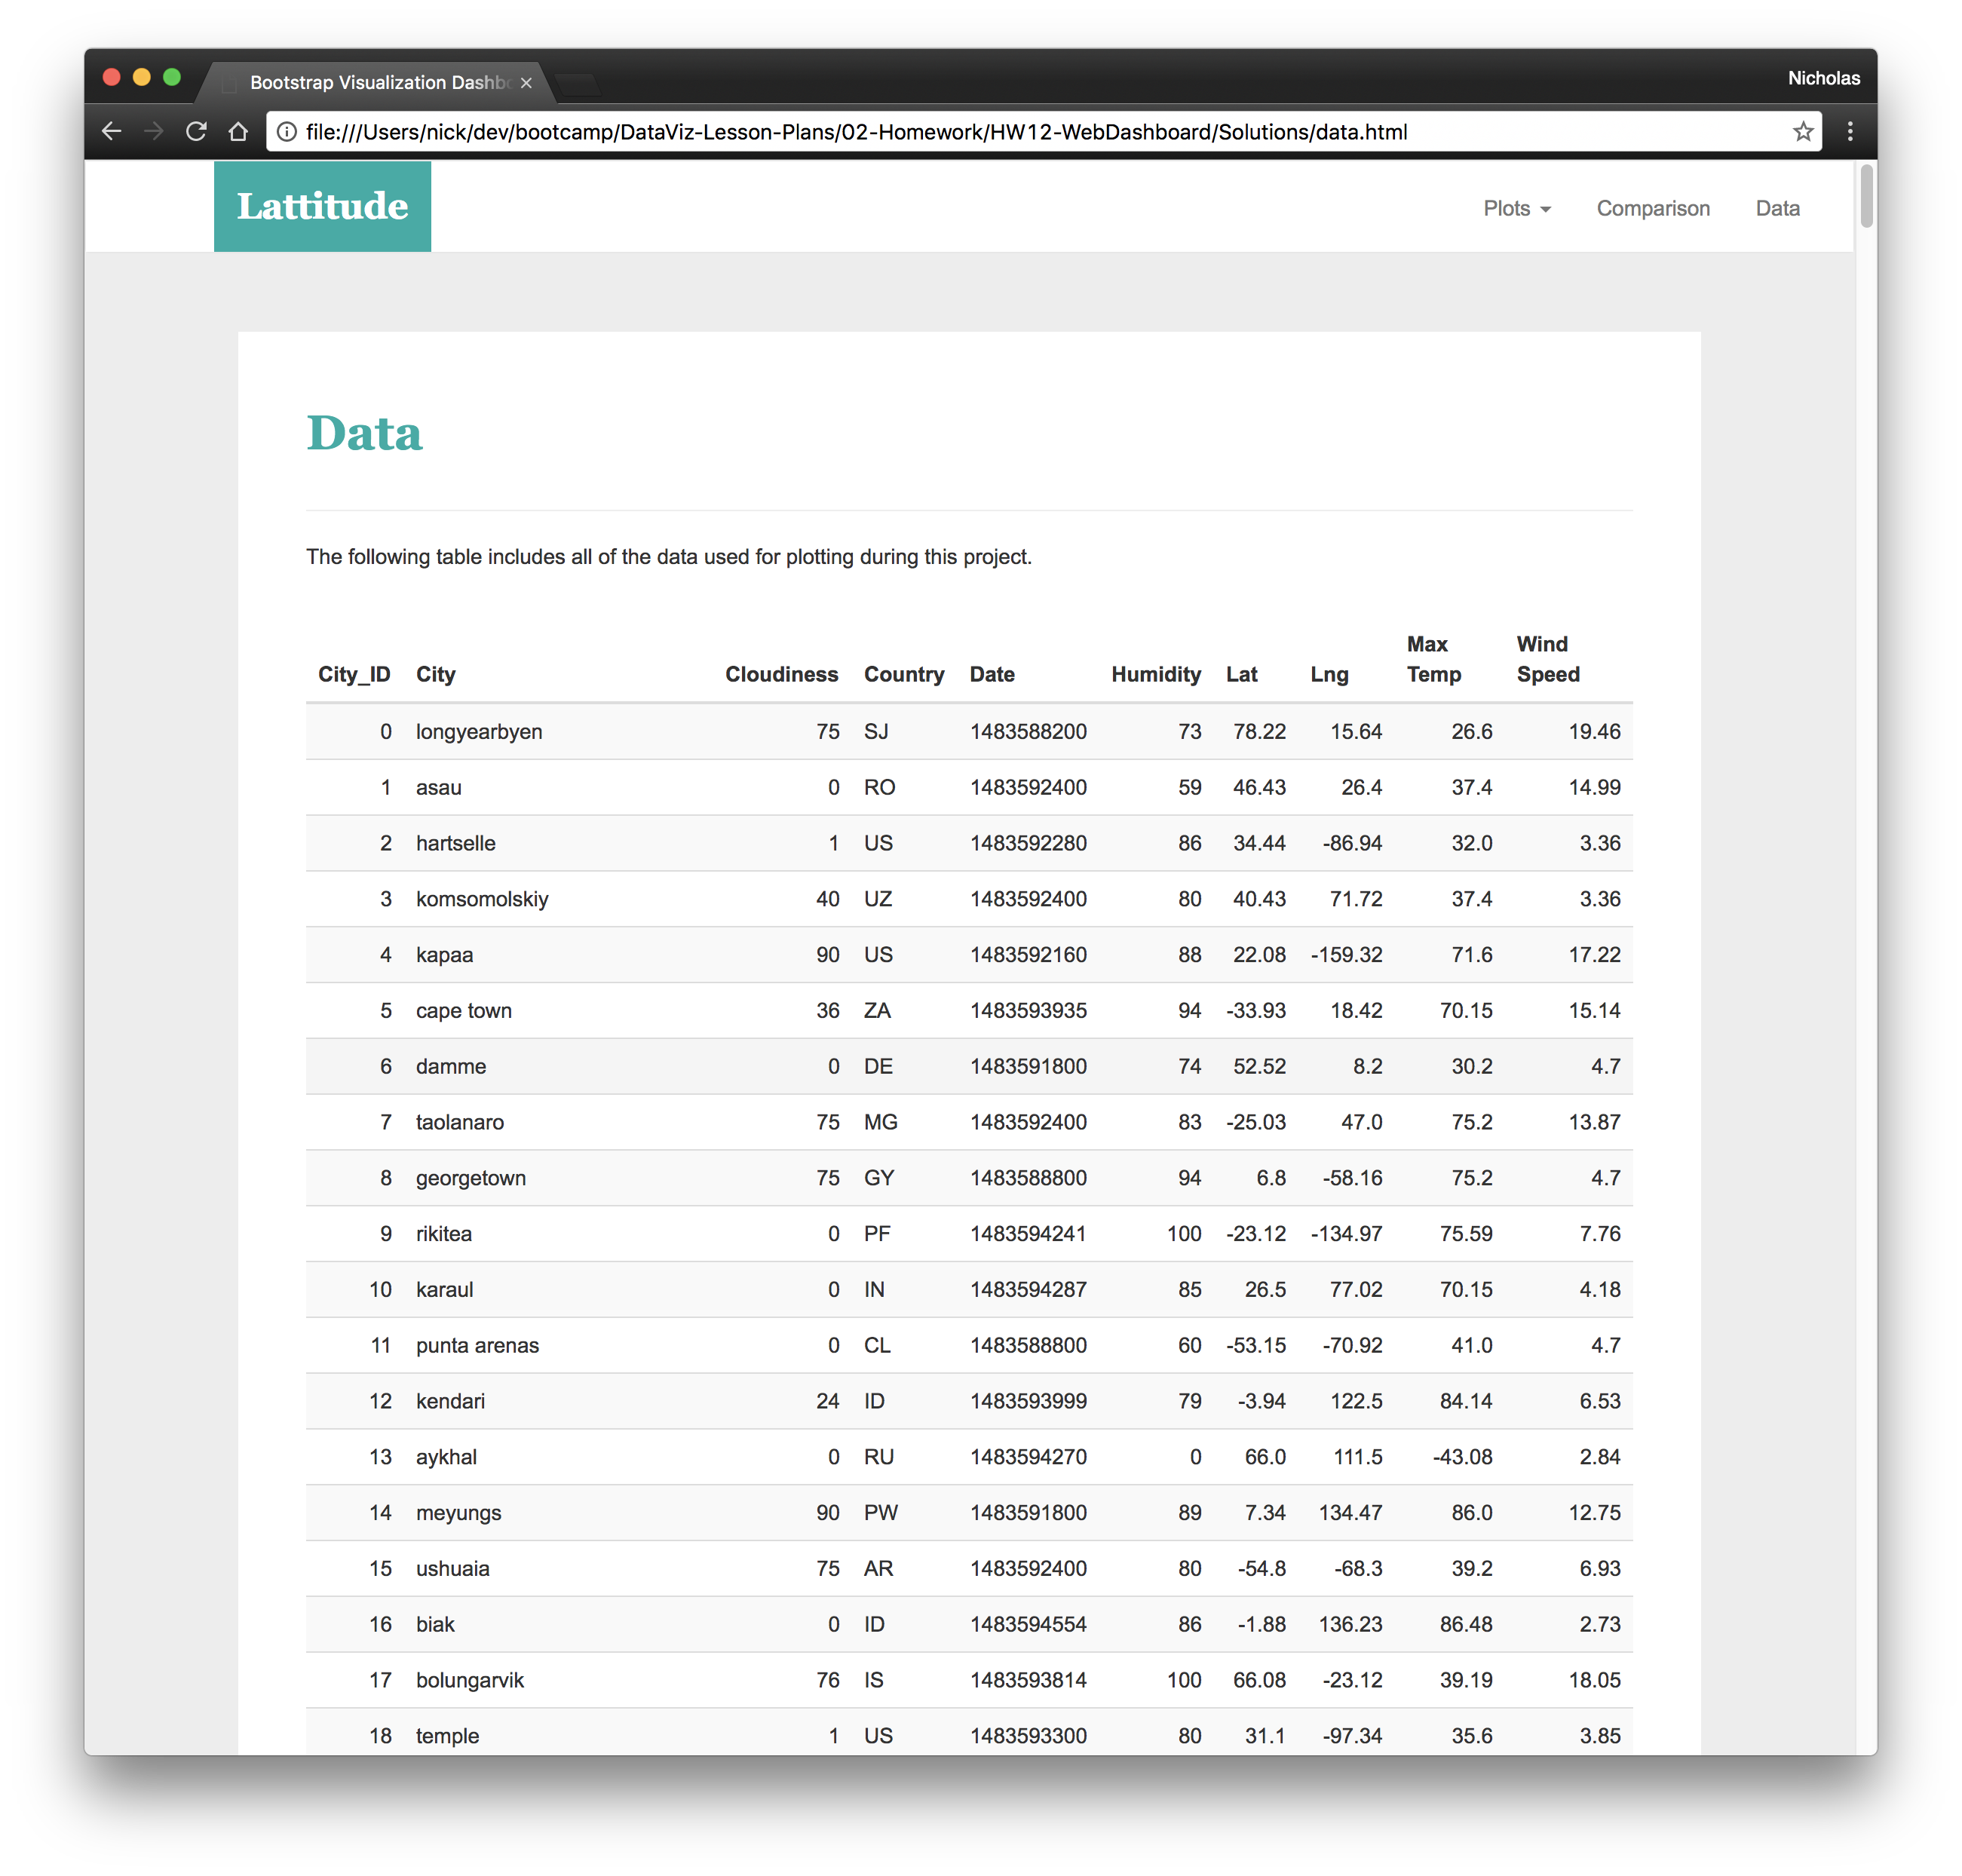
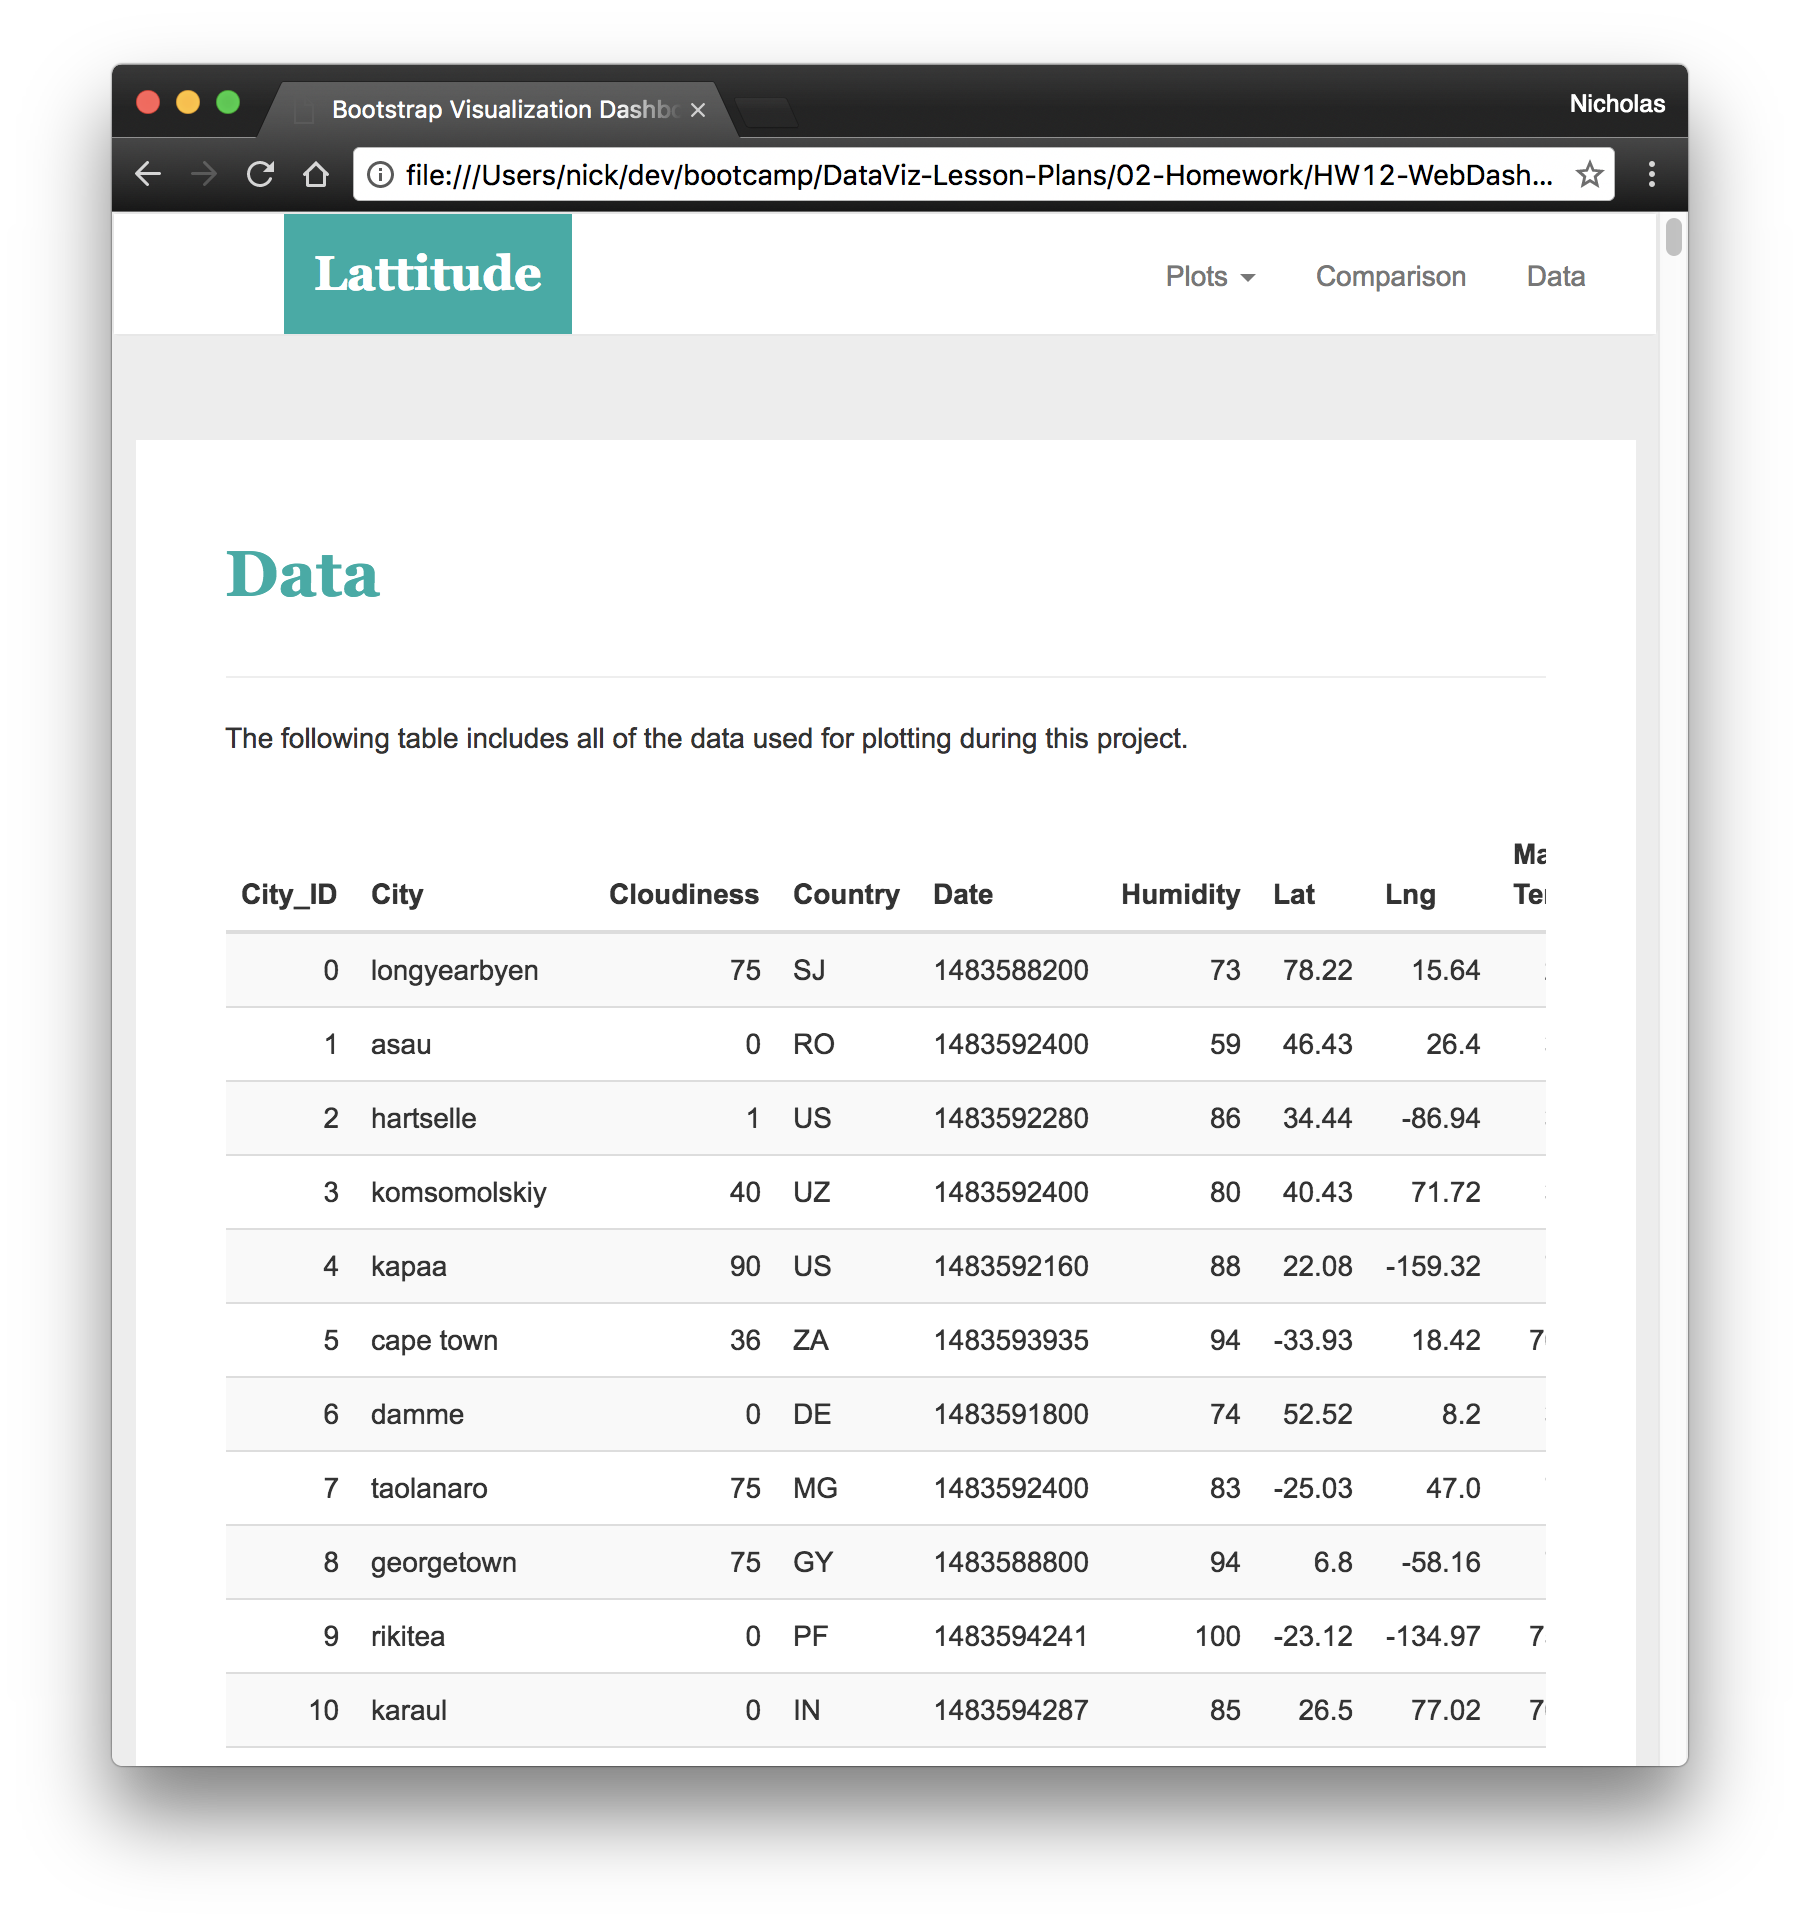
- A “Data” page that:
- Displays a responsive table containing the data used in the visualizations.
- The table must be a bootstrap table component.
- The data must come from exporting the
.csvfile as HTML, or converting it to HTML. Try using a tool you already know, pandas. Pandas has a nifty method approprately calledto_htmlthat allows you to generate a HTML table from a pandas dataframe. See the documentation here
- Displays a responsive table containing the data used in the visualizations.
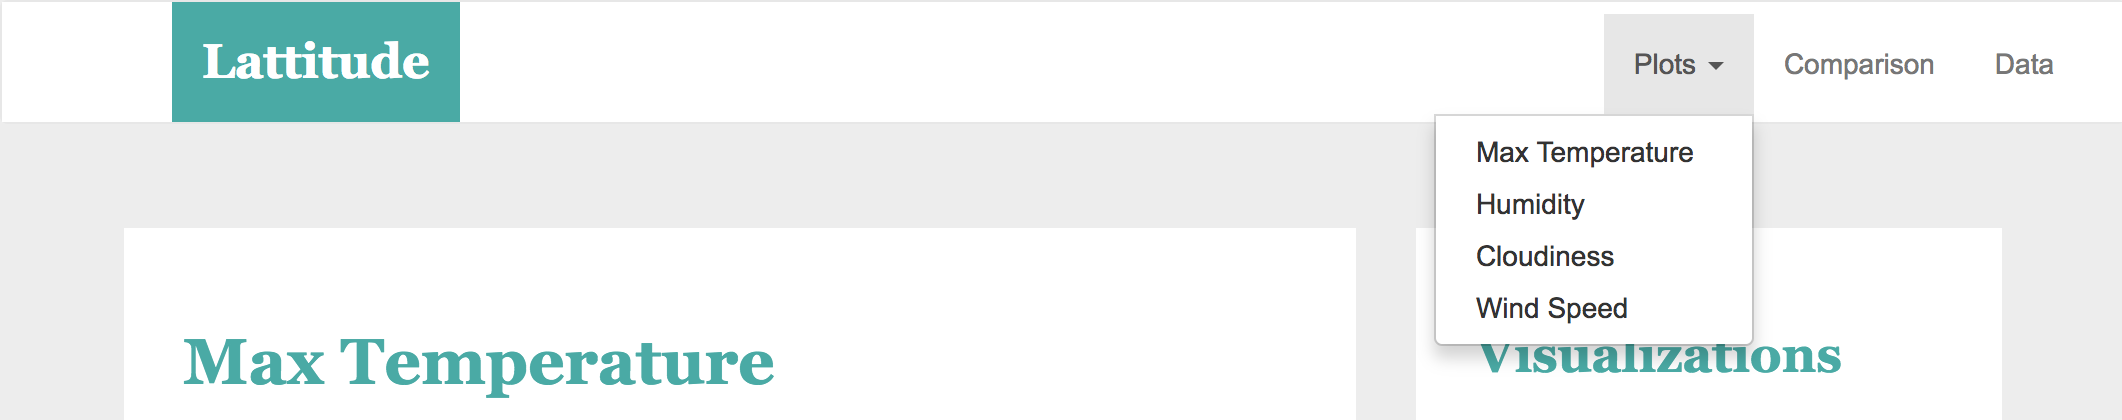
The website must, at the top of every page, have a navigation menu that:
- Has the name of the site on the left of the nav which allows users to return to the landing page from any page.
- Contains a dropdown on the right of the navbar named “Plots” which provides links to each individual visualization page.
- Provides two more links on the right: “Comparisons” which links to the comparisons page, and “Data” which links to the data page.
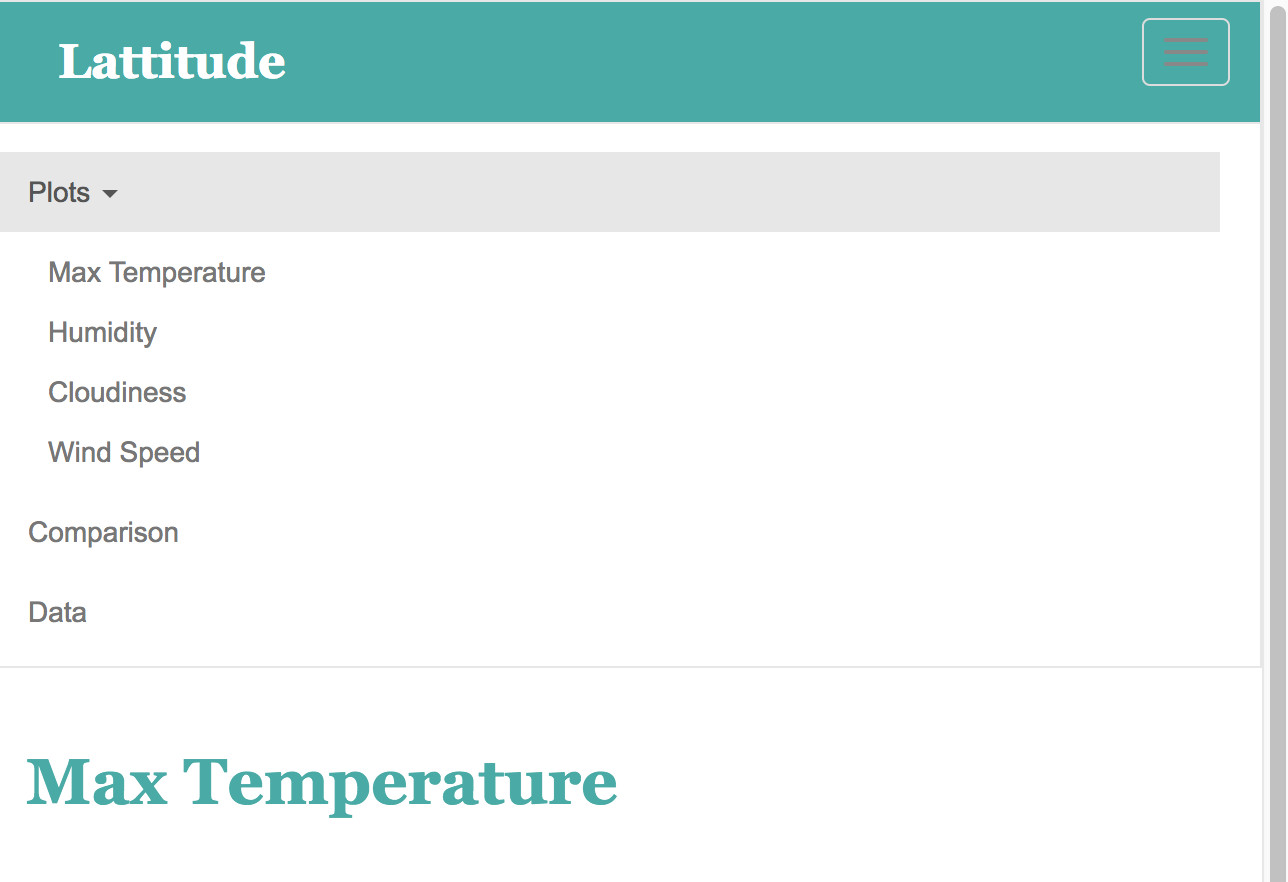
- Is responsive (using media queries). The nav must have similar behavior as the screenshots “Navigation Menu” section (notice the background color change).
Finally, the website must be deployed to GitHub pages.
When finished, submit to BootcampSpot the links to 1) the deployed app and 2) the GitHub repository.
Considerations
- You may use the weather data or choose another dataset. Alternatively, you may use the included cities dataset and pull the images from the assets folder.
- You must use bootstrap. This includes using the bootstrap
navbarcomponent for the header on every page, the bootstrap table component for the data page, and the bootstrap grid for responsiveness on the comparison page. - You must deploy your website to GitHub pages, with the website working on a live, publicly accessible URL as a result.
- Be sure to use a CSS media query for the navigation menu.
- Be sure your website works at all window widths/sizes.
- Feel free to take some liberty in the visual aspects, but keep the core functionality the same.
Bonuses
- Use a different dataset! The requirements above still hold, but make it your own.
- Use a bootstrap theme to customize your website. You may use a tool like Bootswatch. Make it look snazzy, give it some attitude. If using this, be sure you also meet all of the requirements listed above.
- Add extra visualizations! The more comparisons the better, right?
- Use meaningful glyphicons next to links in the header.
- Have visualization navigation on every visualizations page with an active state. See the screenshots below.
Screenshots
This section contains screenshots of each page that must be built, at varying screen widths. These are a guide; you can meet the requirements without having the pages look exactly like the below images.
Landing page
Large screen:
Small screen:

Comparisons page
Large screen:
Small screen:
Data page
Large screen:
Small screen:
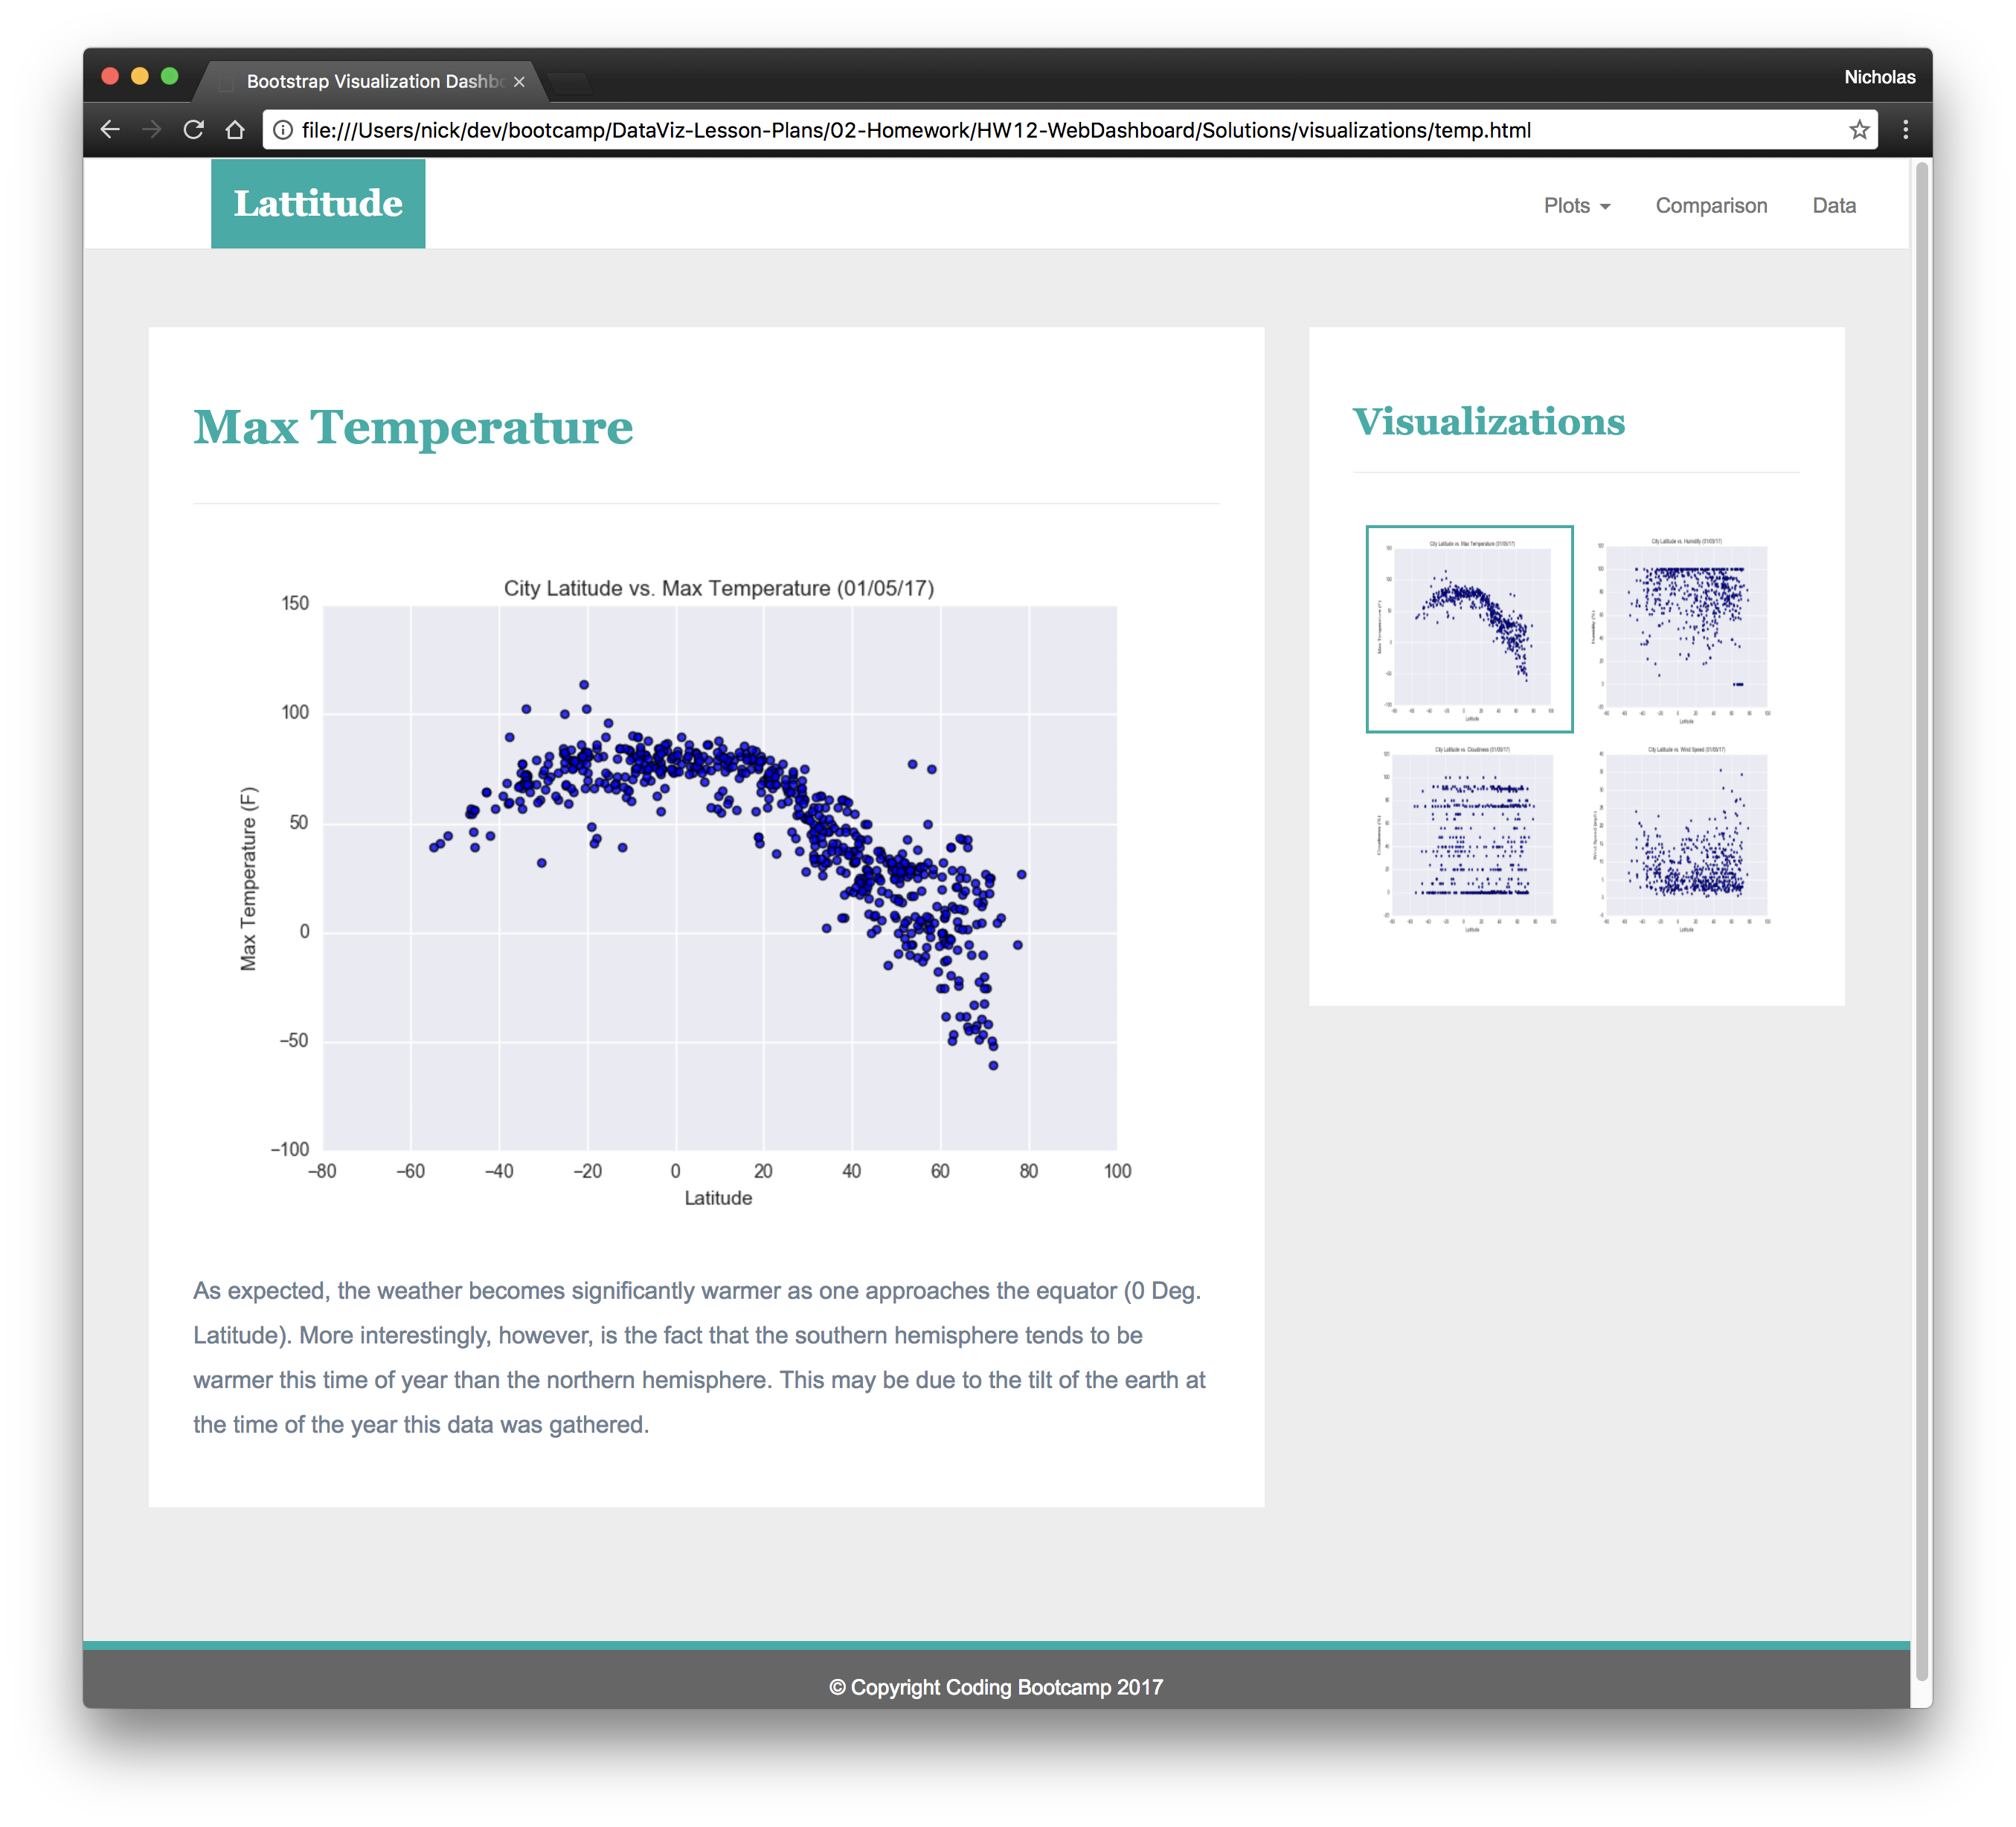
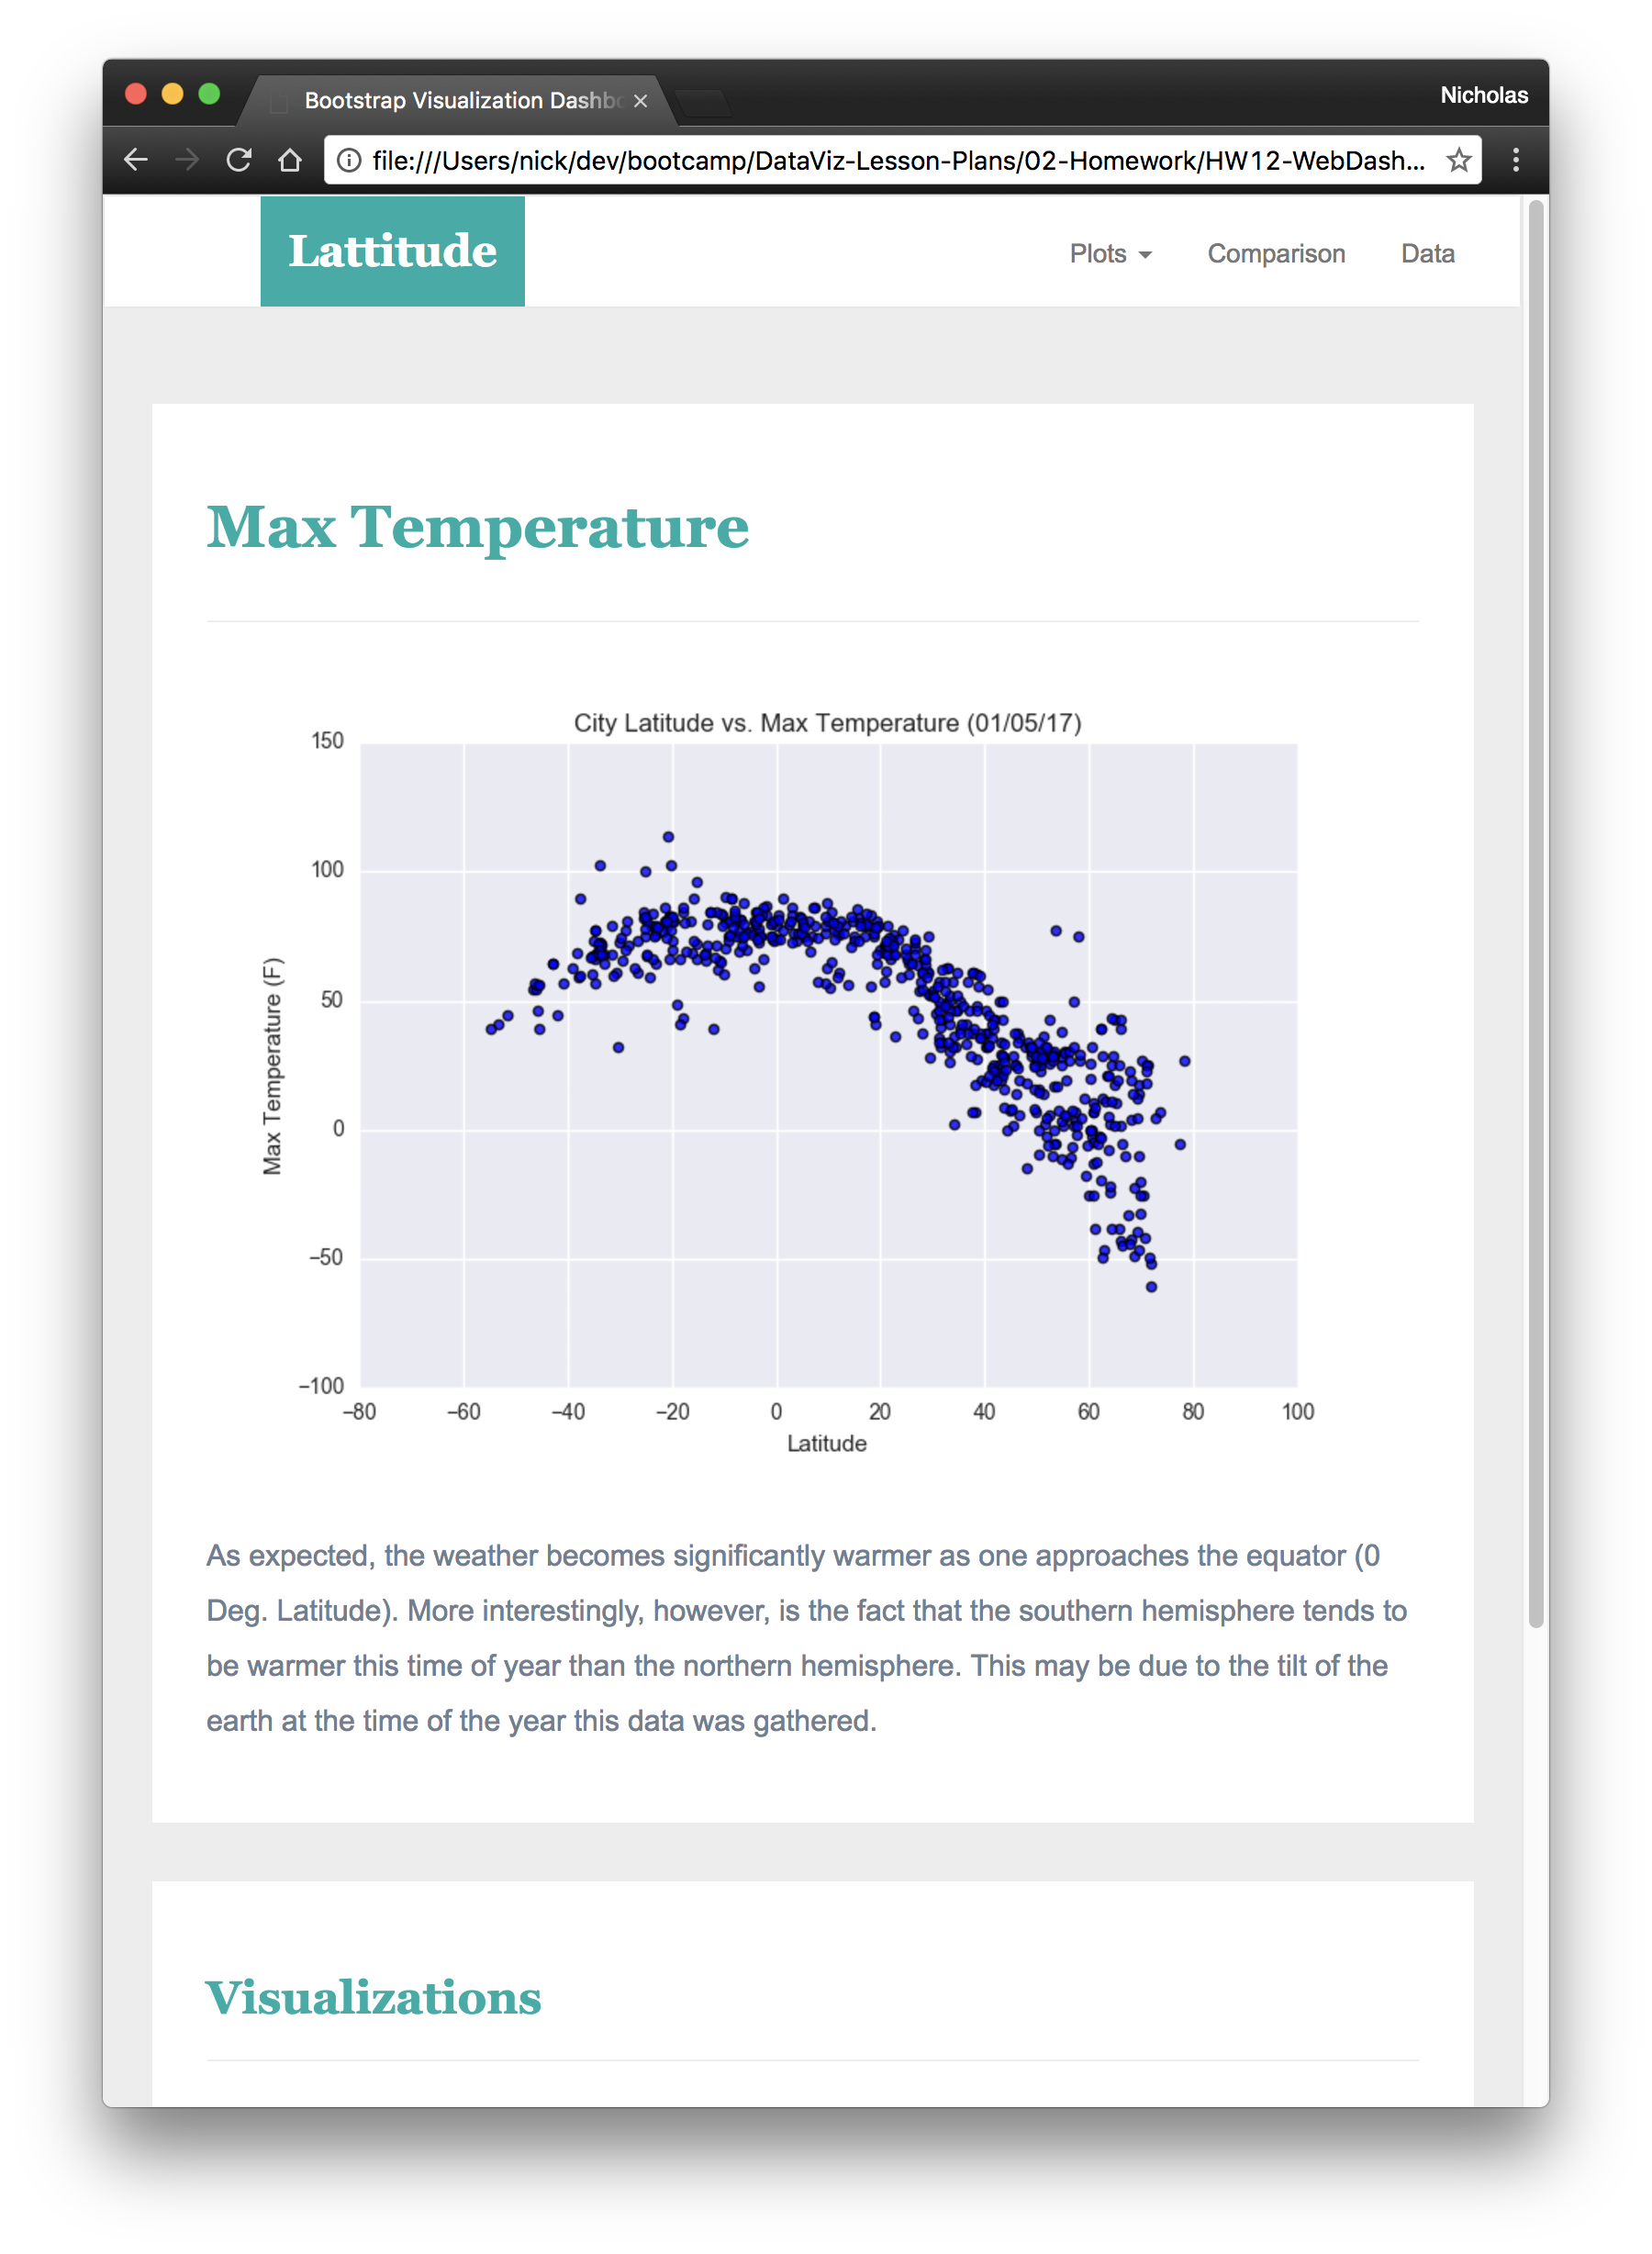
Visualization pages
You’ll build four of these, one for each visualization. Here’s an example of one:
Large screen:
Small screen:
Navigation menu
Large screen:
Small screen: